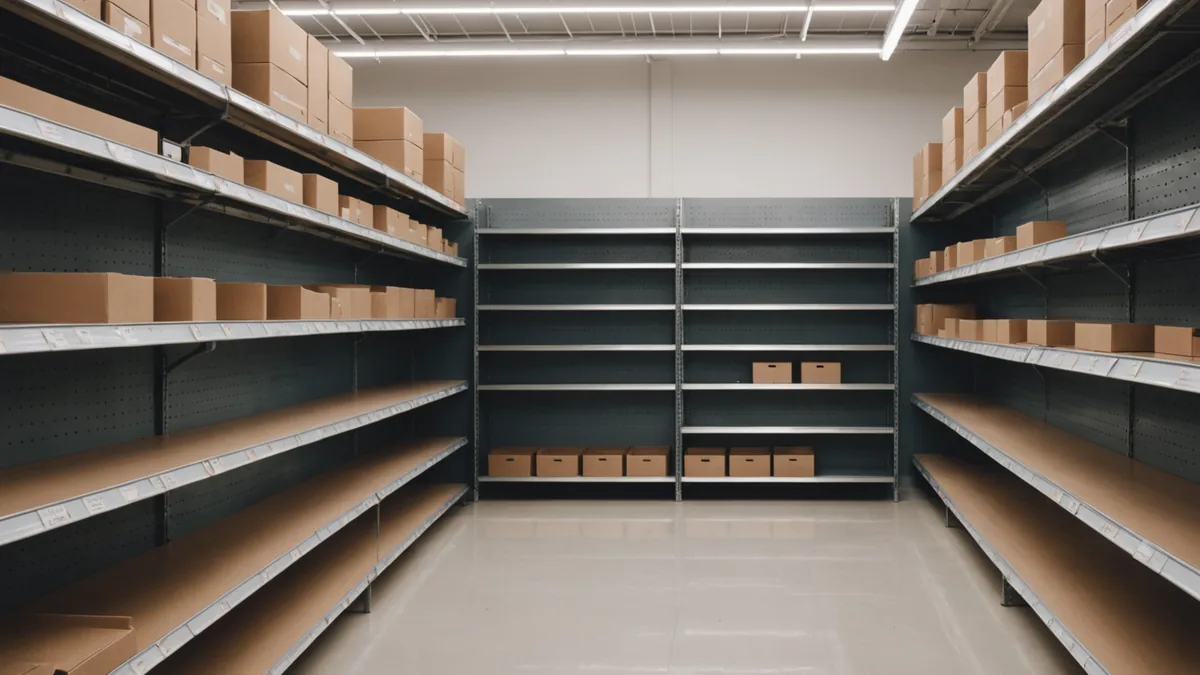
The True Cost of Out-of-Stock for Regional Grocery Chains
Industry estimates typically place grocery out-of-stock rates at 5% to 10% of SKUs at any given moment, but that figure can miss the most expensive part of the day: the gap that appears after the morning check and remains through the afternoon or pre-close period.
That timing issue changes the revenue calculation. A store may report an acceptable OOS rate because an employee found full shelves at shift start. By 3:00 p.m., however, a fast-moving beverage, infant-care product, or pharmacy staple may have been absent for hours. The published rate describes a snapshot. The shopper experiences an event with duration.
For operations directors and buyers, the internal ROI question is therefore not simply, “What percentage of items are out of stock?” It is, “Which items are unavailable, for how long, during which selling hours, and what happens to the intended purchase?”
Why the reported rate understates exposure
Manual shelf checks are useful, but they are usually scheduled around labor availability. In many stores, checks happen near shift start, during opening routines, or at another predictable time. That creates a measurement bias. The check is more likely to record whether a shelf was replenished overnight than whether it stayed available during the highest-risk selling window.
A more useful OOS view has at least four dimensions:
- Event count: how many product gaps occurred.
- Gap duration: how many minutes or hours each gap remained visible.
- Category revenue exposure: the expected sales value of the affected item or category during that period.
- Customer disposition: whether the shopper substituted, abandoned the category, or bought from a competitor.
This distinction matters for regional chains because averages can conceal store-level economics. A low-volume item that is unavailable overnight may have limited financial impact. A high-velocity item that disappears at 4:00 p.m. on a Friday can create a much larger loss even if both events count as one OOS incident.
Substitution behavior adds another layer. Industry-realistic estimates commonly suggest that roughly 30% to 40% of shoppers substitute another item when their intended product is unavailable. The remaining shoppers may leave the category without buying, or purchase from a competitor. Substitution protects some category revenue, but it can also move the customer toward a lower-margin item, a different brand, or a product the store did not intend to promote.
The four cost categories behind an OOS event
1. Lost sale
The most direct cost is the transaction that never occurs. To estimate it, start with the item's normal unit sales during the affected time window and multiply by the selling price. This is not the same as assuming every missed unit becomes a permanent lost sale. Some demand is deferred, and some shoppers choose a substitute.
2. Substitution and margin dilution
A substitute sale is better than no sale, but it may not have the same gross margin or basket effect. A shopper looking for a premium private-label product might select a lower-priced alternative. Another shopper may buy a smaller pack. The revenue loss can therefore be smaller than the unit loss, while the margin loss remains meaningful.
3. Competitor defection and basket loss
When the missing product is a destination item, the shopper may leave the store or add the item to a competitor trip. The impact then extends beyond one SKU. The store may lose adjacent purchases that would have been made during the same visit. This is difficult to measure precisely without transaction and shopper data, so it should be modeled as a range rather than treated as a certain outcome.
4. Operating cost and shrinkage
OOS events also consume labor. Employees spend time checking shelves, searching back rooms, correcting counts, handling emergency replenishment, and investigating whether the issue is inventory, ordering, or execution. A gap can also create a false signal that inventory is unavailable when units are present elsewhere in the store or sitting in the back room. Conversely, inaccurate inventory records can contribute to both replenishment failures and shrinkage investigations.
These costs should not be added without care. Some overlap. For example, an employee's restock time is an operating cost, while the unavailable shelf creates a sales exposure. The purpose of the framework is to separate the variables so a chain can avoid counting the same loss twice.
A per-store calculation framework
A practical starting model can be built from five inputs for each store:
- Number of relevant OOS events per week.
- Average gap duration in hours.
- Expected hourly unit sales for the affected items.
- Average selling price and gross margin.
- Estimated shares of shoppers who substitute, abandon the category, or defect to a competitor.
The basic category revenue exposure formula is:
OOS revenue exposure = affected hourly unit sales × gap duration × average selling price
To make the calculation concrete, consider a plausible example for one regional grocery store. Suppose the store identifies 12 material OOS events per week across high velocity items. Each gap lasts an average of 3 hours. The affected items sell 1.5 units per hour on average, at an average price of $4.50.
| Input | Example value |
|---|---|
| Weekly OOS events | 12 |
| Average gap duration | 3 hours |
| Expected unit sales during gap | 1.5 units per hour |
| Average selling price | $4.50 |
| Gross margin assumption | 28% |
The weekly exposure is 12 × 3 × 1.5 × $4.50, or $243 in potential sales. Over 52 weeks, that is approximately $12,636 in annual revenue exposure for one store before accounting for substitution, delayed purchases, or competitor defection.
At a 28% gross margin, the direct gross profit exposure would be approximately $3,538 annually. That is not a forecast of recoverable profit. It is a baseline for deciding whether better detection and faster response deserve operational investment.
Next, apply a disposition range. If 35% of shoppers substitute, then 65% do not make the intended purchase. Some of that remaining group will abandon the category, and some will shop elsewhere. A chain can model several cases rather than selecting one unsupported assumption:
- Conservative case: most non-substituting shoppers defer the purchase or buy it on a later visit.
- Working case: non-substituting shoppers split between category abandonment and competitor purchase.
- High exposure case: destination items cause more basket loss and competitor defection.
The same calculation can then be repeated across stores using each location's actual event count, category mix, and selling hours. A 20-store grocery chain should not multiply one average store by 20 without adjustment. A high-volume urban location, a smaller convenience-format store, and a pharmacy-led location will have different OOS economics.
Where camera intelligence fits
The operational value of camera intelligence is earlier visibility into the gap, not a claim that every OOS cause disappears. Youtiligent's store operations camera intelligence runs on existing ONVIF cameras and is designed to identify shelf-fill issues, send out-of-stock alerts, score planogram compliance, and detect loss-prevention signals.
For an OOS business case, the key variable is restock latency. If a store detects a gap sooner, the average duration can fall even when the underlying replenishment process remains the same. That is why response time should be tracked alongside OOS rate. A chain can compare the pre-pilot baseline with the period after alerts are introduced, using event count, time to response, and time to shelf recovery.
In Youtiligent's early-access pilot program, measured against each store's own pre-pilot baseline, the pilot cohort recorded a 31% faster restock response time on average. The same early-access pilot program recorded an 18-point planogram compliance lift over a four-week pilot window and a 94% alert accuracy rate across the pilot cohort.
Those figures are useful operating indicators, not a guarantee of recovered revenue. The financial test still requires a chain to connect faster response to its own category sales, labor model, and margin structure.
What camera detection does not solve
A visible shelf gap is an execution signal. It does not automatically identify or correct every cause behind that gap.
- A supplier may deliver late or short a case.
- An ordering parameter may be wrong for a local demand pattern.
- Inventory records may be inaccurate.
- Units may be in the back room, misplaced, damaged, or held for another process.
- A promotion may create demand that the replenishment plan did not anticipate.
Camera analytics can help a team see the shelf condition and prioritize a response. It does not replace purchasing discipline, cycle counts, supplier management, allocation decisions, or store training. The right ROI case should therefore define the intervention narrowly: detect gaps earlier, reduce avoidable restock latency, and give store teams a more consistent view of shelf conditions.
Build the case around recoverable exposure
For a regional chain, the strongest business case is usually not based on eliminating all OOS events. It is based on identifying which portion of the exposure is operationally recoverable.
Start with a small set of high velocity categories. Establish the pre-pilot baseline for OOS events, gap duration, response time, and gross margin. Then compare those measures after alerts are introduced. If a store has $12,636 in annual revenue exposure under the example above, even a partial reduction in gap duration can be more informative than a broad improvement in the reported OOS percentage.
The calculation also gives buyers a common language with operations. Store teams can discuss minutes to response. Merchandising can discuss category revenue and planogram compliance. Finance can test gross profit exposure and payback. A chain can then compare the expected recoverable value with the cost of a pilot or operating tier, rather than treating shelf availability as an abstract service metric.
The practical observation is simple: the shelf check that matters most may be the one taken after the morning report, when the gap has had time to become a sale that will not happen. Reach out to Youtiligent to discuss how to structure a store level OOS baseline using existing cameras.
Back to Store Ops Insights