

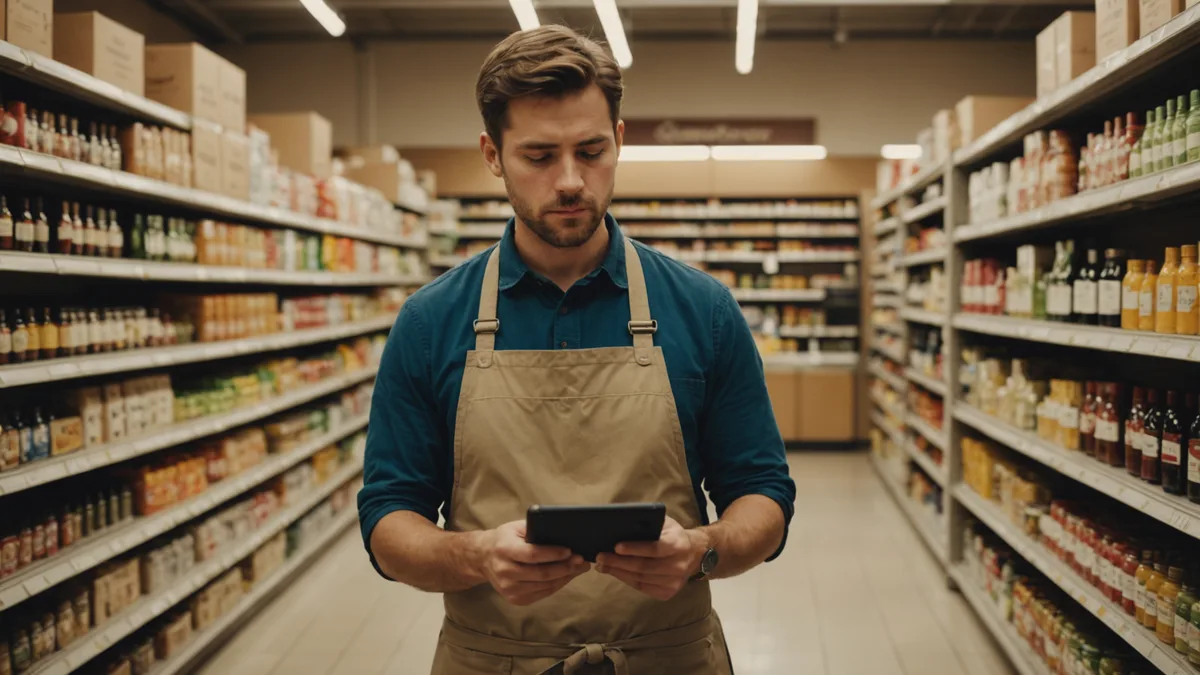
More cameras do not guarantee better operational intelligence. A store can have extensive camera coverage and still be blind to staff efficiency if nothing analyzes the footage. Camera analytics continuously surfaces the same patterns across every store in a chain, changing what an operations director can know about store operations.
What Time-Motion Studies Aim to Answer
Retail borrowed traditional time-motion analysis from manufacturing. Its aim was to understand how staff time is distributed across tasks: how long a full restock of a gondola bay takes, how much time goes to customer assistance versus backroom work, and where idle time concentrates and why. The findings support scheduling, task assignment, and decisions about where process changes could have the greatest effect.
Manual time-motion studies have structural limitations rather than methodological ones. An observer in a store for two weeks records a sample of behavior, but staff often change their behavior when they know they are being watched. The study covers one store during that period. Applying the same analysis to ten or fifteen stores requires ten or fifteen separate engagements, at considerable cost and over a timeline that makes the findings progressively less actionable.
Video analytics preserves the time-motion framework while automating data collection, removing the observer effect, and extending continuous coverage to every camera in every store simultaneously.
What Camera Analytics Can Measure
It is important to define what the technology can and cannot measure reliably. Overstating its capabilities creates disappointed expectations and poor deployment decisions.
Zone occupancy over time is the most reliable output: which store areas have staff present and when. This directly supports scheduling analysis. If a department has zero staff coverage during consistent 45-minute windows on Tuesday afternoons, the data reveals it without manual observation.
Task state inference is less direct. The model can distinguish a staff member restocking near a shelf, standing at a checkout station, or moving through a corridor. These are broad activity categories, not exact task classifications. A staff member restocking in aisle three looks different from a customer browsing there, and the model distinguishes them with reasonable accuracy. It does not judge whether the restocking is efficient or slow.
Response time for alert-generating events can be tracked end to end. When the system produces a restock alert or compliance flag, it can measure the time until a staff member appears in the flagged zone. Over time, this creates a picture of how quickly different stores, shifts, and times of day respond to operational events. That store-level data, let alone comparable data across multiple stores, did not exist before.
The Scheduling Insight Gap
Regional retail scheduling typically relies on historical transaction volume: more staff are scheduled when past data shows more customer transactions. This reasonably reflects customer-facing demand, but misses operational demand, such as when restocking is most needed, compliance drift tends to peak, and backroom receiving pulls floor staff away.
In our pilot data, floor occupancy patterns often differed from POS-driven scheduling assumptions. One repeated pattern is that early-week morning shifts are frequently understaffed for floor tasks relative to late-week shifts. Transaction volume misses this because Monday morning transaction volume is lower, implying a lower staffing need. Yet Monday morning is also when the store is recovering from weekend traffic, so restocking demand is high while customer-facing demand is moderate. A schedule optimized for transactions misallocates staff against the operational workload.
We are not saying this pattern is universal. Every chain and format will have its own patterns. The point is that camera analytics can reveal patterns that POS data alone cannot, without a weeks-long study. Running the analytics for a few weeks and reviewing the results is enough to identify them.
What It Is Not
This is not employee surveillance for productivity monitoring, and we make that clear with every chain we work with. The output is aggregated operational data: zone coverage, response times, and task-state distributions by shift and time window. It does not track individual performance. A store manager sees "Tuesday 2pm has 40 minutes with no staff coverage in produce" rather than "Marta spent 22 minutes in the back room without a productive task."
This distinction matters ethically and practically. Continuous individual performance monitoring has labor-law compliance implications in many jurisdictions, including under Israeli labor law, where several of our current pilots operate. In practical terms, detailed individual surveillance can create a defensive staff culture that reduces operational performance. Zone-level operational data avoids both problems.
Video analytics shows how time is distributed across zones and tasks. It cannot explain why that distribution looks the way it does. Whether an inefficiency reflects training, zone layout, or unusual customer volume requires a manager with context to interpret. The data may indicate a scheduling problem, but the diagnosis requires human judgment.
Multi-Store Deployment Considerations
The value of floor analytics grows with scale. A manager can run a single store using an intuitive sense of where coverage gaps occur. In a chain with 15 or 20 stores, that knowledge exists at the store level, not the chain level. An operations director overseeing all stores has no comparable ground-level feel for every location.
Camera analytics gives the operations director a chain-level view for finding outliers: a store that consistently trails peers on response time metrics, a shift configuration that repeatedly creates floor coverage gaps, or a department with structural understaffing not reflected in transaction data. These insights guide chain-level operating decisions and improve outcomes across multiple locations, not only one.
Deployment does not require new hardware. The analysis runs on existing camera feeds. In our current process, setting up a new store means configuring zone mapping and alert thresholds for the existing camera positions. For a chain that already has CCTV coverage, the marginal installation burden is low.
Linking Floor Data to Operational Outcomes
Floor analytics is most valuable when connected to other operational metrics: restock completion times, compliance scores, and customer wait times at checkout. Actionable insights emerge from the relationship between coverage patterns and these outcomes. Slower response times to restock alerts on certain shifts are interesting. Showing that they correlate with higher stockout duration at the end of the day connects the data to a revenue-visible outcome.
Creating these connections takes time and requires the chain to collect and organize operational data for correlation. For chains just beginning, the first step is making coverage data visible. The analytical connections can follow.